
Methodology
MiniPCs.zip is built to help you find the best Mini PC for your needs and budget. Multiple times a day, we scan stores like Amazon, eBay, Newegg, and Best Buy - and compare their products to find the best deals. We chart PCs horizontally on price, and vertically by how good of a deal they are.
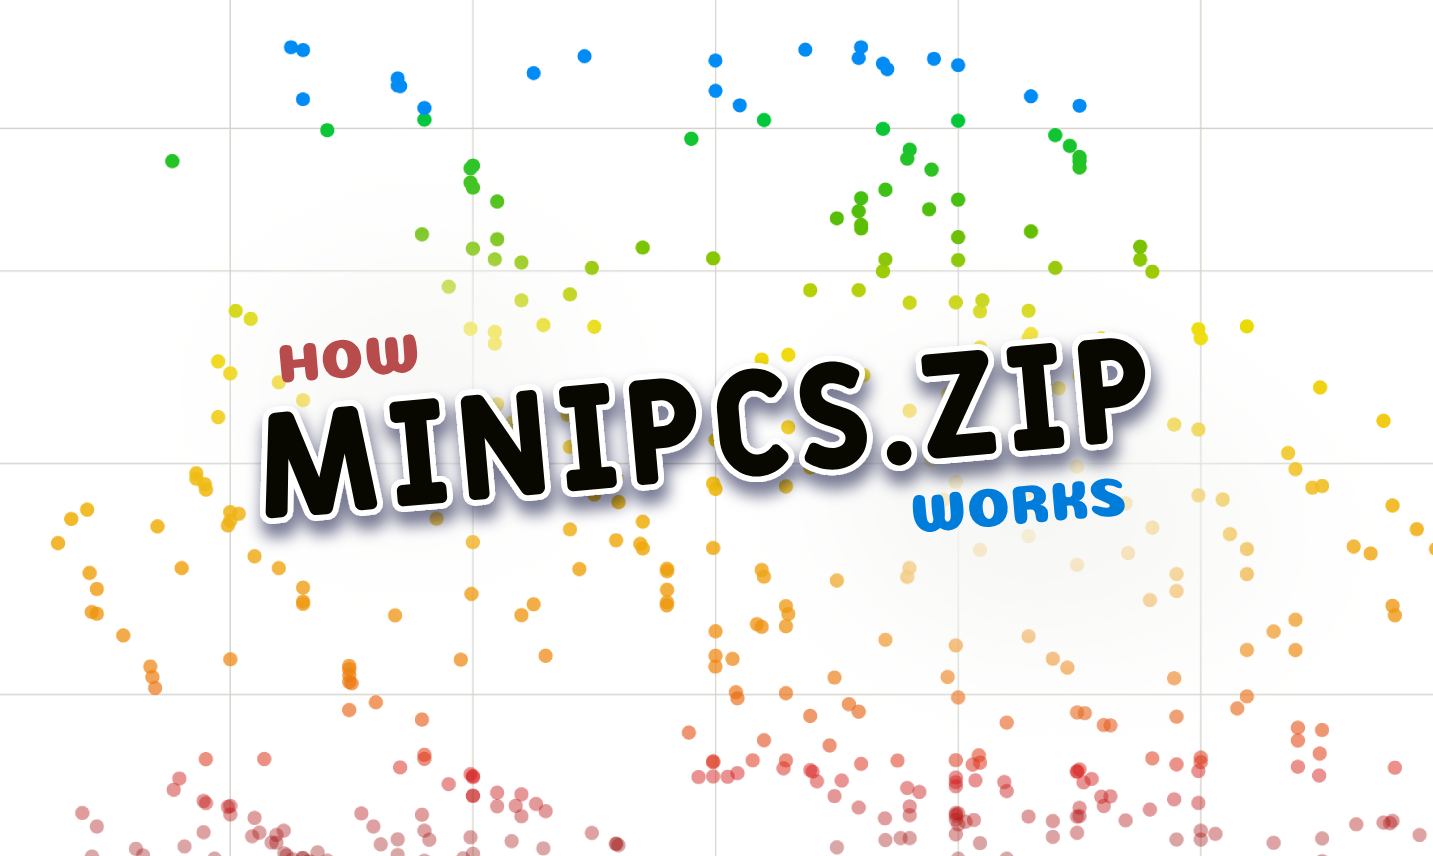
When plotted like this, it becomes clear how random the pricing for Mini PCs can be. The same machine can bee $100 cheaper depending on which retailer is selling it - and different machines with identical specs can have an even more significant delta. Seeing thousands of options listed at once makes it so much easier to be sure you’re getting the best deal for your money.
Step 1: Learn what the market values
We start by fitting a price model to the current catalog. Given the 2000+ listings, we can feed every PC as a bundle of specs into a sort-of regression model. This bundle of specs includes CPU performance, GPU performance, memory, and storage.
An earlier version of the site simply used this price model and compared the expected price of a machine vs the retail price. Then you could say “this machine could cost $300, but they’re selling it for $250, good deal!” This model was useful, but not perfect, for a number of reasons. Most importantly, there is no one-size-fits-all when it comes to PC buying.
Step 2: Adjust for what you’re shopping for
If you’re buying a PC for Gaming, having a good GPU and sufficient RAM are far more important than having a good CPU that doesn’t draw a lot of power. The opposite might be true if you’re buying a PC for a mini home server.
Here is where we also apply some manually tuned heuristics based on what you’re shopping for. If you’re buying a Mini PC for a streaming server, we bump up models that support transcoding. If you’re buying a Mini PC for Gaming, we push down PCs that have 8GB of RAM. These heuristics are simple but effective.
For each of the ranking methods, we weight the relevant specs more or less than the average pricing model does. This very quickly brings relevant machines to the top, and irrelevant ones to the bottom, even if they’re decent for other use cases.
Step 3: Compare against the right peers
Now that we have a ballpark price estimate that is weighted to value certain applications (e.g. Gaming or Plex Server) more than others, we need to add a local normalization layer.
Put simply - no one cares if the $900 machine is a really, really good deal if your budget is $300. We want to rank PCs by how good they are for their budget. The price model is extremely useful for building an initial ranking system - but is not guaranteed to be consistent across large price ranges.
With a moving window, we answer two questions for each machine, and adjust accordingly:
- “Of the machines in this budget, how does its weighted spec-rating compare?”
- “Of machines with these specs, how many cost less or more?”
This allows us to create a cleaner distribution across price ranges. It doesn’t particularly change the order of the results - but rather the scaling, resulting in a more readable and usable chart. Sort of like when you turn on volume normalization on your TV - boosting the soft parts and quieting the loud parts.*
Step 4: Reading the chart
Once we have this normalized, peer-compared, price-model-grounded system, we can then map it onto the colours you see on the chart and in the detail panel:
- Blue: 97 and above. The handful of listings that are, right now, the very best buys of their kind. Usually either on a good sale, or a rare used deal.
- Green: 90–97. A great deal.
- Yellow: 80–90. Can be a good buy if it matches the specs you need.
- Orange: 65–80. You can almost certainly find a better deal for the price, or a cheaper price for those specs.
- Red: 0–65. Avoid - or browse to find a comically bad deal and laugh about it.
* I don’t care for volume normalization and do not endorse it. The reason it’s good in our use case is that the performance of Mini PCs tends to cluster around common models of CPU, and standard amounts of RAM or storage (e.g. 16GB, 512GB). This, in addition to the relatively simple regression pricing model, means that in order to pull apart differences more cleanly, it helps to locally normalize.